Punnett Square for Sickle Cell disease and theoretical and experimental probability
In the United States about 100,000 people have the Sickle Cell disease and 2.5 million have sickle cell traits.
Source Center for Disease Control
Introduction
This page has information and activities to introduce the Punnett Square and the genetics of the Sickle Cell Disease (SCD) and explore theoretical and experimental probabilities of parents with different alleles, related to the disease, will have offspring with or with out SCD traits. Instructional suggestions, activities, worksheets, data sheets, and lab sheets are included.
Pedagogy suggestions
Focus questions
- What is Sickle Cell Disease?
- What has been the understanding and treatment of Sickle Cell Disease (SCD)?
- What is theoretical and experimental probability?
- What is a Punnett Square?
- How can I use it to determine the probability of parents passing their traits or Sickle Cell Disease?
- If there is a treatment, why does the disease persist?
Activity sequence
- Ask. What is Sickle Cell Disease?
- Share the introduction.
- Ask. What has been the understanding and treatment of Sickle Cell Disease (SCD)?
- Share the history.
- Have the vocabulary or word bank available to introduce as questions arise as to the meanings of words in the introduction, history, or activities.
- Ask. What is theoretical and experimental probability?
- Punnett square activity. Share the Activity lab sheets
- Ask what are all possible ways parents ight combine to have offspring?
- Review the theoretical probability lab sheet to find all possible outcomes of parents offspring.
- Assign each of six possible parent pairs for learners to use Punnett Squares to find the possible traits of their offspring.
- Use the lab sheets with Punnett Squares to calculate the possible traits for the offspring of different pairs of parents.
- Share the results of the Punnett Squares for the six pairs of parents and the genetic outcomes for the offspring.
Six unique parent pairs with genetic outcomes
When you actually solve the Punnett squares for all 9 combinations, they consolidate into 6 uniquely distinct genetic outcomes. Here is the master breakdown for possible pairs of parents and the exact proportions for the offspring of any couple:
Parent Pair Group: What the Punnett Square Proves (Offspring Proportions)
1. AA x AA: 100% AA
(0% chance of passing on an s allele)
2. AA x ss
(or ss x AA): 100% As
(100% of children are carriers; 0% have the disease)
3. ss x ss: 100% ss
(100% of children will have sickle cell disease)
4. AA x As
(or As x AA): 50% AA : 50% As
(An equal split of normal and carrier outcomes)
5. As x ss
(or ss x As): 50% As : 50% ss
(An equal split of carrier and disease outcomes)
6. As x As
(Both Parents Carriers): 25% AA : 50% As : 25% ss
(The classic 1:2:1 genetic ratio)
- Complete the experimental outcomes simulation lab.
- Complete lab discussion and lab sheets.
- Check your understanding of probability with this probability rubric
- Considerations for grading
- Distinctions of genetic and mathematical probability
Introduction
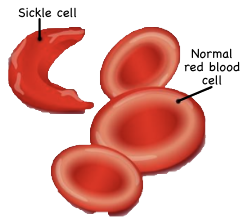
Sickle cell disease (SCD) is traced to one gene. The gene that makes hemoglobin, the protein in red blood cells that carries oxygen throughout the body. In the case of sickle cell the genetic mutation makes sickle-shaped red blood cells instead of normal round cells. These mishaped cells, clog small blood vessels, reduce oxygen tranported to organs, tissues, and cells. This blockage causes extreme pain and organ damage as they move through the body.
One severe example is Acute chest syndrome (ACS), which can be severe when sickle cells wedge into and damage the lung tissue as they move through them. With less oxygen flow, cells, tissues, and organs can fail and medical pathologies can arise. Ranging from anemia, jaundice, acute vascular necrosis to blindness, debilitating strokes, cognitive impairment, end-stage organ damage, and premature death. SCD is more common in certain ethnic groups, including people of African descent. Life expectancy varies considerably between 5 to 50 years, completely depending on the availability of advanced medical care. While historical treatment were mostly limited to palliative care (relieving symptoms without curing the condition) and blood transfusions, recent medical treatments related to genetic deletion and replacement of sickle cell genes can with healthy genes will hopefully offer better treatment options.
History
- 1874, First clinical description of SCD as a blood disease. The physician Dr. James Africanus Beale Horton describes the first clinical descriptions of patients as having recurrent seasonal fevers, local pain crisis during rainy seasons and abnormal blood characteristics. Characteristics of SCD.
- 1949, First description of SCD as a molecular disease. Dr. Linus Pauling and his colleagues first show SCD as a blood disorder caused at the molecular level, by an abnormal β-globin protein chain in the oxygen-carrying molecule hemoglobin.
- 1956, First description of SCD as a genetic code mutation disease. Scientist Vernon Ingram shows the exact point of the genetic mutation that changes a negatively charged amino acid (glutamic acid) with an uncharged one (valine). Which causes hemoglobin chains to stiffen and collapse into the sickle cells shape.
- Modern era, Molecular biologists discover that before humans are born, they have a gene that makes a healthy gene called fetal hemoglobin. Shortly after birth, a biological molecular switch is clicks off the fetal version and switches on the adult β-globin gene, activating the sickle cariant i homozygous individuals.
A therapy
2023, First curative treatment. The U.S. Food and Drug Administration (FDA) approved Casgevy and Lyfgenia, developed and manufactured by Vertex Pharmaceuticals and CRISPR Therapeutics. Casgevy, uses CRISPR-Cas9 gene editing act like a pair of molecular scissors. Instead of replacing the faulty gene, it snips the and deactivates the genetic pepressor switch. By breaking the switch, the patient's bone marrow restarts the production of healthy fetal heoglobin, bypassing the sickle mutatio entirely.
The challenge
While a scientific miracle, accessing these cures presents an economic and logistical problem. The base list price for the gene theraphy alone is $2.2 million (Casgevy) and $3.1 million (Lyfgenia) per patient. When you include the entire treatment, of weeks of hospitalization to harvest stem cells, intensive chemotherapy to clear out the bone marrow, and months of post-treatment recovery, then the total medical cost typically reaches $3 million to $4 million per patient, putting it far out of reach for the majority of global patients.
Source
Science. The History and Future of Sickle Cell Disease. by Adrian Woolfson. August 22, 2026. Includes a review of, Curved Air: A Biography of Sickle Cell Anemia and the Quest to Cure the First Molecular Disease.
Vocabulary - word band
Allele is an alternative sequence variation of a specific gene. Variations arise from mutations and dictate individual traits. At least one allele from each parent (sometimes more). Making at least two alleles for every gene.
Chromatin is the uncoiled, relaxed structural material composed of DNA, RNA, and associated scaffolding proteins that forms chromosomes during nuclear division cycles.
Chromosome is a highly structured, condensed molecule of DNA (deoxyribonucleic acid ) wrapped around structural proteins. Humans typically possess 46 chromosomes organized into 23 homologous pairs (one from each parent), making the full genome.
Gene is the locus of specific nucleotide sequences along a DNA strand that holds biochemical functional blueprints instructing cells on how to manufacture individual target proteins (e.g., adult β-globin).
Genome is the complete set of genes (consisting of chromosomes made of DNA) in the cell.
Genotype is the specific allelic pairing inherited at a particular locus (e.g., AA, As, ss) defining genetic architecture that determine a trait.
Phenotype is the outward, clinically observable physical features, physiological functions, or structural traits expressed by an organism resulting from its unique genotype and environmental interactions. Like: eye color, height, hair color, or anything, even different proteins.
Probability vocab
Probability is how likely it is that a specific event will happen. In math, we find this by writing a ratio (a fraction between 0 and 1).
Before an event (Theoretical): We compare the number of outcomes we are looking for to the total number of all possible outcomes.
Theoretical probability is the mathematical prediction of what should happen in a perfect scenario over infinite trials.
After an experiment (Experimental): We compare the number of times the outcome we are looking for actually happened to the total number of times we tried.
Experimental probability is what actually happens in a real-world test. They differ because real life is governed by random chance, and small sample sizes (like 20 flips) rarely match perfect mathematical averages
Determining probability
Probability is determined in one of two ways: theoretical and experimental. Either way: the probability of an outcome is the number of specific outcomes out of the total number of all possible outcomes of one event. Probability data sheet or data center.
This is for informational purposes only. For medical advice or diagnosis, consult a professional.
Explore the genetic nature with the following activities.
Activities
Lab Goal: to use Punnett Squares to systematically calculate and compare the theoretical probability of inheriting sickle cell traits against an active, and simulated experimental probability using coin flips.
Enjoy!
Theoretical probability lab sheet
Mendelian inharitance background information: Children always inherit one allele from each biological parent. And the matching pair dictates the child's absolute internal genotype and outward physical phenotype.
The two alleles that determine the genotype can be represented as A (normal) and s (sickle). The table below describes them and the different combinations possible.
Genetic key:
| Allele / Genotype symbol | Bilogical expression & phenotype outcome |
|---|---|
| A | Dominate allele for normal, round hemoglobin production. |
| s | Recessive allele for sickle shaped hemoglobin production. |
| Possible pairings | |
AA (homozyygous dominate) |
Normal red blood cells. Individual does not carry or pass on the sickle mutation. Normal |
As or sA (heterozyygous / carrier) |
Clinically healthy; has the sickle cell trait and can pass the s allele to offspring. Carrier / Trait |
ss (homozyygous recessive) |
Has sickel cell disease (SCD) all red blood cells are vulnerable to sickel cell disease. Sickle Cell Disease |
To explore possible combinations and check to see if we have found all parent combinations, we can use a matrix (grid) where every possible father genotype(top row) is matched against every possible mother genotype (first colmn). This matching mathematically guarantees you map all 9 possible parent pairs:
All possible outcomes
| AA | As | ss | |
|---|---|---|---|
| AA | Pair 1: AA x AA | Pair 2: AA x As | Pair 3: AA x ss |
| As | Pair 4: As x AA | Pair 5: As x As | Pair 6: As x ss |
| ss | Pair 7: ss x AA | Pair 8: ss x As | Pair 9: ss x ss |
Note: Biologically, AA x As and As x AA yield the exact same offspring ratios, but tracking them as separate pairs ensures your population math remains proportionaly accurate.
Summary
By using the 3x3 Parent Grid to identify the cross, and then applying one of the 6 master outcomes, you will never miss a combination and you will know the exact baseline probability for the specific outcomes you are looking for.
To find out the allell pairs of two parents offspring for these six possible combinations we can use a Punnett Square to determine them.
Punnett Square - Scenario one
Suppose two people who are both carriers for the sickle cell trait decide to have children. Both the mother and father have the heterozygous genotype: As.
Use what you have learned and the rule of dominance below to comlete the standard Punnett Square for this parental pairs As x As:
The Rule of Dominance
- The Capital Letter Goes First: We always write the dominant allele (capital letter) before the recessive allele (lowercase letter).
- No Order of Inheritance: The final genotype is written to show what alleles are present, not the order in which they were handed down. Because of this, any "unset sA " combination is automatically flipped to unset As as a standard spelling rule in biology.
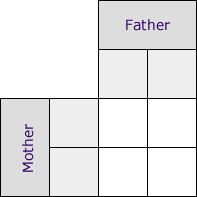
Based on your Punnett Square matrix, write the exact theoretical mathematical probabilities as a fraction and percentage:
1. What is the probability of these parents having an offspring born with Sickle Cell Disease (ss)?
Fraction: __________ Percentage: __________%
2. What is the probability of these parents having a child who is healthy and completely free of the disease (AA or As)?
Fraction: __________ Percentage: __________%
3. What is the probability of an offspring being an unaffected carrier (As) of the sickle cell trait?
Fraction: __________ Percentage: __________%
4. What is the probability of a child inheriting two normal genes (AA), meaning they cannot pass on the trait?
Fraction: __________ Percentage: __________%
Punnett Square - Scenario two
Use the Punnett squares to show other theoretical possibilities?
Based on your Punnett Square matrix, write the exact theoretical mathematical probabilities as a fraction and percentage:
1. What is the probability of these parents having an offspring born with Sickle Cell Disease (ss)?
Fraction: __________ Percentage: __________%
2. What is the probability of these parents having a child who is healthy and completely free of the disease (AA or As)?
Fraction: __________ Percentage: __________%
3. What is the probability of an offspring being an unaffected carrier (As) of the sickle cell trait?
Fraction: __________ Percentage: __________%
4. What is the probability of a child inheriting two normal genes (AA), meaning they cannot pass on the trait?
Fraction: __________ Percentage: __________%
Punnett Square - Scenario three
Based on your Punnett Square matrix, write the exact theoretical mathematical probabilities as a fraction and percentage:
1. What is the probability of these parents having an offspring born with Sickle Cell Disease (ss)?
Fraction: __________ Percentage: __________%
2. What is the probability of these parents having a child who is healthy and completely free of the disease (AA or As)?
Fraction: __________ Percentage: __________%
3. What is the probability of an offspring being an unaffected carrier (As) of the sickle cell trait?
Fraction: __________ Percentage: __________%
4. What is the probability of a child inheriting two normal genes (AA), meaning they cannot pass on the trait?
Fraction: __________ Percentage: __________%
Punnett Square - Scenario four
Based on your Punnett Square matrix, write the exact theoretical mathematical probabilities as a fraction and percentage:
1. What is the probability of these parents having an offspring born with Sickle Cell Disease (ss)?
Fraction: __________ Percentage: __________%
2. What is the probability of these parents having a child who is healthy and completely free of the disease (AA or As)?
Fraction: __________ Percentage: __________%
3. What is the probability of an offspring being an unaffected carrier (As) of the sickle cell trait?
Fraction: __________ Percentage: __________%
4. What is the probability of a child inheriting two normal genes (AA), meaning they cannot pass on the trait?
Fraction: __________ Percentage: __________%
Experimental probability (Simulation)
Real life involves random chance. While Punnett squares give us the exact mathematical prediction, actual families experience genetic inheritance like a coin toss.
In this simulation, you will flip a coin twice for each child to determine the allele given by each carrier parent.
Simulation Rules:
- Obtain a coin.
- For every trial (child), you will execute two flips:
- Flip 1 (Father's Contribution): Flip the coin. Heads = A, Tails = s. Record it.
- Flip 2 (Mother's Contribution): Flip the coin again. Heads = A, Tails = s. Record it.
- Final Combination: Merge the two choices to determine the child's final genotype and downstream health phenotype.
- Repeat this physical process complete 20 distinct times to simulate a family cohort of 20 children.
Child # |
Dad's Flip (A/s) |
Mom's Flip (A/s) |
Child |
Child (Normal/ |
Child # |
Dad's Flip (A/s) |
Mom's Flip (A/s) |
Child |
Child (Normal/ |
|---|---|---|---|---|---|---|---|---|---|
1 |
|
|
|
|
11 |
|
|
|
|
2 |
|
|
|
|
12 |
|
|
|
|
3 |
|
|
|
|
13 |
|
|
|
|
4 |
|
|
|
|
14 |
|
|
|
|
5 |
|
|
|
|
15 |
|
|
|
|
6 |
|
|
|
|
16 |
|
|
|
|
7 |
|
|
|
|
17 |
|
|
|
|
8 |
|
|
|
|
18 |
|
|
|
|
9 |
|
|
|
|
19 |
|
|
|
|
10 |
|
|
|
|
20 |
|
|
|
|
Data Tally Summary: Calculate your simulated totals out of 20 and multiply by 5 to find your experimental percentage!
Genotype Group Tally
Total (Count out of 20)
Calculated Experimental % (Total × 5)
Normal (AA)
Carrier Trait (As)
Sickle Cell Disease (ss)
What is the experimental probability of these parents having a child with sickle cell?
What is the probability of these parents not having a child with sickle cell?
What is the probability of these parents not passing on the allele for sickle cell to their children?
What is the probability of these parent passing on the allele for sickle cell to their children?
Laboratory Discussion
1. Compare your experimental percentages directly to your theoretical percentages.
Did your coin flips yield the exact 25% AA, 50% As, and 25% ss distribution predicted by the Punnett square?
Describe how much they varied.
2. Why is there typically a distinct difference between a theoretical mathematical prediction and active experimental results?
What would happen if you combined the data from your entire classroom (e.g., 500 total coin flips instead of just 20)?
3. If a person is born with the heterozygous carrier genotype (As), which specific cellular and molecular functions are normal, and what risks do they face or pass along?
4. Imagine you are a genetic counselor. What scientific, medical, financial, and ethical realities would you advise an As carrier couple to consider if they are planning to have children?
5. Reflect on the CRISPR-Cas9 curative therapy discussed in the introduction. Why do structural health disparities exist where a functional molecular cure is engineered but remains virtually inaccessible to most patients worldwide?
Discussion:
In the theoretical probability the result (AA or As; 50% AA or 50% As) was certain. In the Experimental, the probability can change.
How much do you think the probability might change from the theoretical?
Why?
Which genotype is more favorable in reducing the probability of a child being born with sickle cell disease?
Are there any parental genotypes that guarantee all children will be born with sickle cell disease?
As a parent what would you want to consider if a sickle cell disease is a possibility for your offspring?
What is the difference between the theoretical probability and the experimental findings?
Why is there a difference?
Check your understanding of probability with this probability rubric
Sample Answers
Punnett Square Scenario As x As
Suppose two people who are both carriers for the sickle cell trait decide to have children. Both the mother and father have the heterozygous genotype: As.
Use the information to comlete the standard Punnett Square for this parental pairs As x As below:
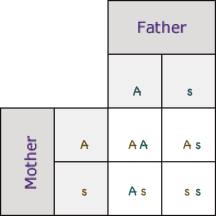
Based on your Punnett Square matrix, write the exact theoretical mathematical probabilities as a fraction and percentage:
1. What is the probability of these parents having an offspring born with Sickle Cell Disease (ss)?
Fraction: 1/4 Percentage: 25%
2. What is the probability of these parents having a child who is healthy and completely free of the disease (AA or As)?
Fraction: 3/4 Percentage: 75%
3. What is the probability of an offspring being an unaffected carrier (As) of the sickle cell trait?
Fraction: 1/2 Percentage: 50%
4. What is the probability of a child inheriting two normal genes (AA), meaning they cannot pass on the trait?
Fraction: 1/4 Percentage: 25%
Punnett Square Scenario AA x As
Use the Punnett squares to show other theoretical possibilities?
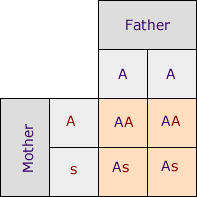
Based on your Punnett Square matrix, write the exact theoretical mathematical probabilities as a fraction and percentage:
1. What is the probability of these parents having an offspring born with Sickle Cell Disease (ss)?
Fraction: 0 Percentage: 0%
2. What is the probability of these parents having a child who is healthy and completely free of the disease (AA or As)?
Fraction: 4/4 Percentage: 100%
3. What is the probability of an offspring being an unaffected carrier (As) of the sickle cell trait?
Fraction: 1/2 Percentage: 50%
4. What is the probability of a child inheriting two normal genes (AA), meaning they cannot pass on the trait?
Fraction: 1/2 Percentage: 50%
Sample Experimental probability (Simulation)
Note: Student data will vary due to the random nature of coin tosses! Use this as an exemplar for grading calculations.
Child # |
Dad's Flip (A/s) |
Mom's Flip (A/s) |
Child |
Child (Normal/ |
Child # |
Dad's Flip (A/s) |
Mom's Flip (A/s) |
Child |
Child (Normal/ |
|---|---|---|---|---|---|---|---|---|---|
1 |
A |
A |
AA |
|
11 |
A |
A |
AA |
|
2 |
s |
A |
As |
|
12 |
s |
s |
ss |
|
3 |
s |
s |
ss |
|
13 |
A |
A |
AA |
|
4 |
s |
A |
As |
|
14 |
A |
s |
As |
|
5 |
A |
A |
AA |
|
15 |
A |
s |
As |
|
6 |
A |
s |
As |
|
16 |
A |
A |
AA |
|
7 |
s |
s |
ss |
|
17 |
S |
A |
As |
|
8 |
s |
A |
As |
|
18 |
A |
s |
As |
|
9 |
A |
A |
AA |
|
19 |
s |
s |
ss |
|
10 |
s |
s |
ss |
|
20 |
A |
s |
As |
|
Data Tally Summary: Calculate your simulated totals out of 20 and multiply by 5 to find your experimental percentage!
Genotype Group Tally
Total (Count out of 20)
- Normal (AA) = 6
- Carrier Trait (As) = 9
- Sickle Cell Disease (ss) = 5
Calculated Experimental % (Total × 5)
What is the experimental probability of these parents having a child with sickle cell? ss(5)
5 X 5 = 25%
What is the probability of these parents not having a child with sickle cell? AA (6) , As (9)
(6 + 9) X 5 = 75%
What is the probability of these parents not passing on the allele for sickle cell to their children? AA(6)
6 X 5 = 30%
What is the probability of these parent passing on the allele for sickle cell to their children? (As) = 9 (ss) = 5
99 = 50 x 5 = 70%
Critical Laboratory Discussion
Discussion:
1. Compare your experimental percentages to your theoretical percentages.
Did your coin flips yield the exact 25% AA, 50% As, and 25% ss distribution predicted by the Punnett square?
What is the difference between the theoretical probability and the experimental findings?
In the theoretical probability the result (AA or As; 50% AA or 50% As) was certain. In the Experimental the probability can change.
Why is there a difference?
Theoretical probability is the mathematical prediction of what should happen in a perfect scenario over infinite trials. Experimental probability is what actually happens in a real-world test. They differ because real life is governed by random chance, and small sample sizes (like 20 flips) rarely match perfect mathematical averages.
What would happen if you combined the data from your entire classroom (e.g., 500 total coin flips instead of just 20)?
3. How much do you think the probability might change from the theoretical? Why?
It can change by a noticeable amount (e.g., getting 35% instead of 25% for the disease). This happens because 20 trials is a very small sample size. Random chance can lead to streaks of heads or tails, causing the real-world results to swing away from the mathematical prediction.
4. Which genotype is more favorable in reducing the probability of a child being born with sickle cell disease?
The AA genotype is the most favorable. Individuals with AA do not suffer from the disease and have a 0% chance of passing a mutated sickle cell allele to their future offspring.
5. Are there any parental genotypes that guarantee all children will be born with sickle cell disease?
Yes. If both parents have sickle cell disease (ss × ss), they can only pass down the "s" allele. Therefore, 100% of their children will inherit the ss genotype and have the disease.
6. If a person is born with the heterozygous carrier genotype (As), which specific cellular and molecular functions are normal, and what risks do they face or pass along?
7. As a parent what would you want to consider if a sickle cell disease is a possibility for your offspring?
Parents might want to seek genetic counseling or testing to learn if they are carriers (As). They would need to weigh the emotional and physical impact of the disease, consider the astronomical cost of modern gene therapies ($2M–$4M), and look into medical support systems available in their area.
Question 7 Follow-up
Imagine you are a genetic counselor. What scientific, medical, financial, and ethical realities would you advise an As carrier couple to consider if they are planning to have children?
8. Reflect on the CRISPR-Cas9 curative therapy discussed in the introduction. Why do structural health disparities exist where a functional molecular cure is engineered but remains virtually inaccessible to most patients worldwide?
Check your understanding of probability with this probability rubric
Considerations for grading
Criteria |
Highly Proficient (4) |
Proficient (3) |
Developing (2) |
Punnett Square (25%) |
Matrix is completely filled out with accurate combinations (AA, As, ss). |
Matrix has minor combination errors but shows clear logic. |
Matrix is incomplete or shows conceptual misunderstanding. |
Math & Percentages (25%) |
All conversions from fractions or counts to percentages are 100% accurate. |
Math is mostly correct with only 1 or 2 minor calculation errors. |
Significant mathematical errors or percentages do not total 100%. |
Lab Execution (25%) |
20 distinct dual-coin flips are recorded logically with complete data fields. |
20 flips are recorded, but table layout has tracking gaps. |
The simulation was cut short or data rows are missing. |
Critical Thinking (25%) |
Discussion answers demonstrate deep insight into sample sizing and CRISPR equity. |
Answers are complete and scientifically accurate but lack depth. |
Answers are brief, missing core logic, or left blank. |
Distinctions of genetic and mathematical probability
How this applies Mathematically
Mathematically, order must be considered to maintain accuracy when calculating probabilities.
Genetics allows us to simplify the final written answer (sA) to As because of the biology of dominance, however, math treats As and sA as two completely separate pathways. In math, if you do not count them as two distinct outcomes, your mathematical proportions will be completely wrong.
Here is why biology hides the order but math demands it.
A Mathematical Problem: The Two-Coin Paradox
Imagine you flip two different coins (a penny and a nickel) at the exact same time.
You want to know the probability of getting one Head and one Tail.
If you ignore order, you might look at the possible outcomes and say there are only 3:
- Two Heads (HH)
- Two Tails (TT)
- One Head, One Tail (HT)
If you treat these 3 outcomes as equally likely, you would say the probability of getting one Head and one Tail is 1 out of 3 ( 33.3%).
But this is mathematically incorrect. If you actually run the experiment, you will get one Head and one Tail 50% of the time.
To get the accurate proportion, math requires you to look at the order of the coins:
- Pathway 1: Penny is Heads, Nickel is Tails (HT)
- Pathway 2: Penny is Tails, Nickel is Heads (TH)
Because HT and TH are two different physical events, there are actually 4 total possibilities (HH, HT, TH, TT).
The outcomes we are looking for (one Head, one Tail) happens in 2 out of those 4 pathways 2/4 = 50%.
How This Applies Directly to Genetics
When a mother and a father create a child, they are flipping two genetic coins at the exact same time.
If two carrier parents (As x As) have a child, the mathematical reality inside the reproductive cells looks like this:
Pathway |
Egg (Mother) |
Sperm (Father) |
Mathematical Result |
Biological Simplification |
|---|---|---|---|---|
1 |
A |
A |
AA |
AA (Normal) |
2 |
A |
s |
As |
As (Carrier) |
3 |
s |
A |
sA |
As (Carrier) |
4 |
s |
s |
ss |
ss (Disease) |
If you ignore the order of how those alleles met, you would only count 3 biological categories (AA, As, ss) and incorrectly assume the child has a 1/3 or 33.3% chance of being a carrier.
By keeping the grid structure of a Punnett square intact, we are secretly forcing the math to respect order (Pathway 2 vs. Pathway 3). Even though we rewrite sA as As at the very end to satisfy the biology rule, we still count it as a distinct box. This ensures we find that the true probability is 2/4 or 50%, matching real-world observations.
Summary
- When Calculating: Order always matters. Track every single pathway separately to get the total number of possibilities (the denominator).
- When Writing: Order is ignored. Group the matching pathways together and flip the letters to put the capital letter first.
Last edited - October 10, 2026